I’ve long since desired to produce a more modern remake of a church liturgical calendar that displays the historically observed seasons of the year and key dates of worship. With some heavy use of the Figma arc tool, plus a sunburst chart in Tableau, and a bit of layering, I was able to create the calendar shown here.
All in ideas
Tableau Visual Resume Templates
Creating a visual resume using tableau is a fun and easy way to showcase your skills and stand out among other applicants. This post walks through a few templates that can be used to begin to construct your own visual resume.
Leader Lines and Labels for Small Map Polygons in Tableau
Tableau’s spatial functions make it easy to create dynamic leader lines for small polygon map labels. This is just a quick post that demonstrates how to create them and how they can be used to add clarity to your visualization.
Reflections on IronViz
Some reflections on my process participating in IronViz, the world’s largest data visualization competition.
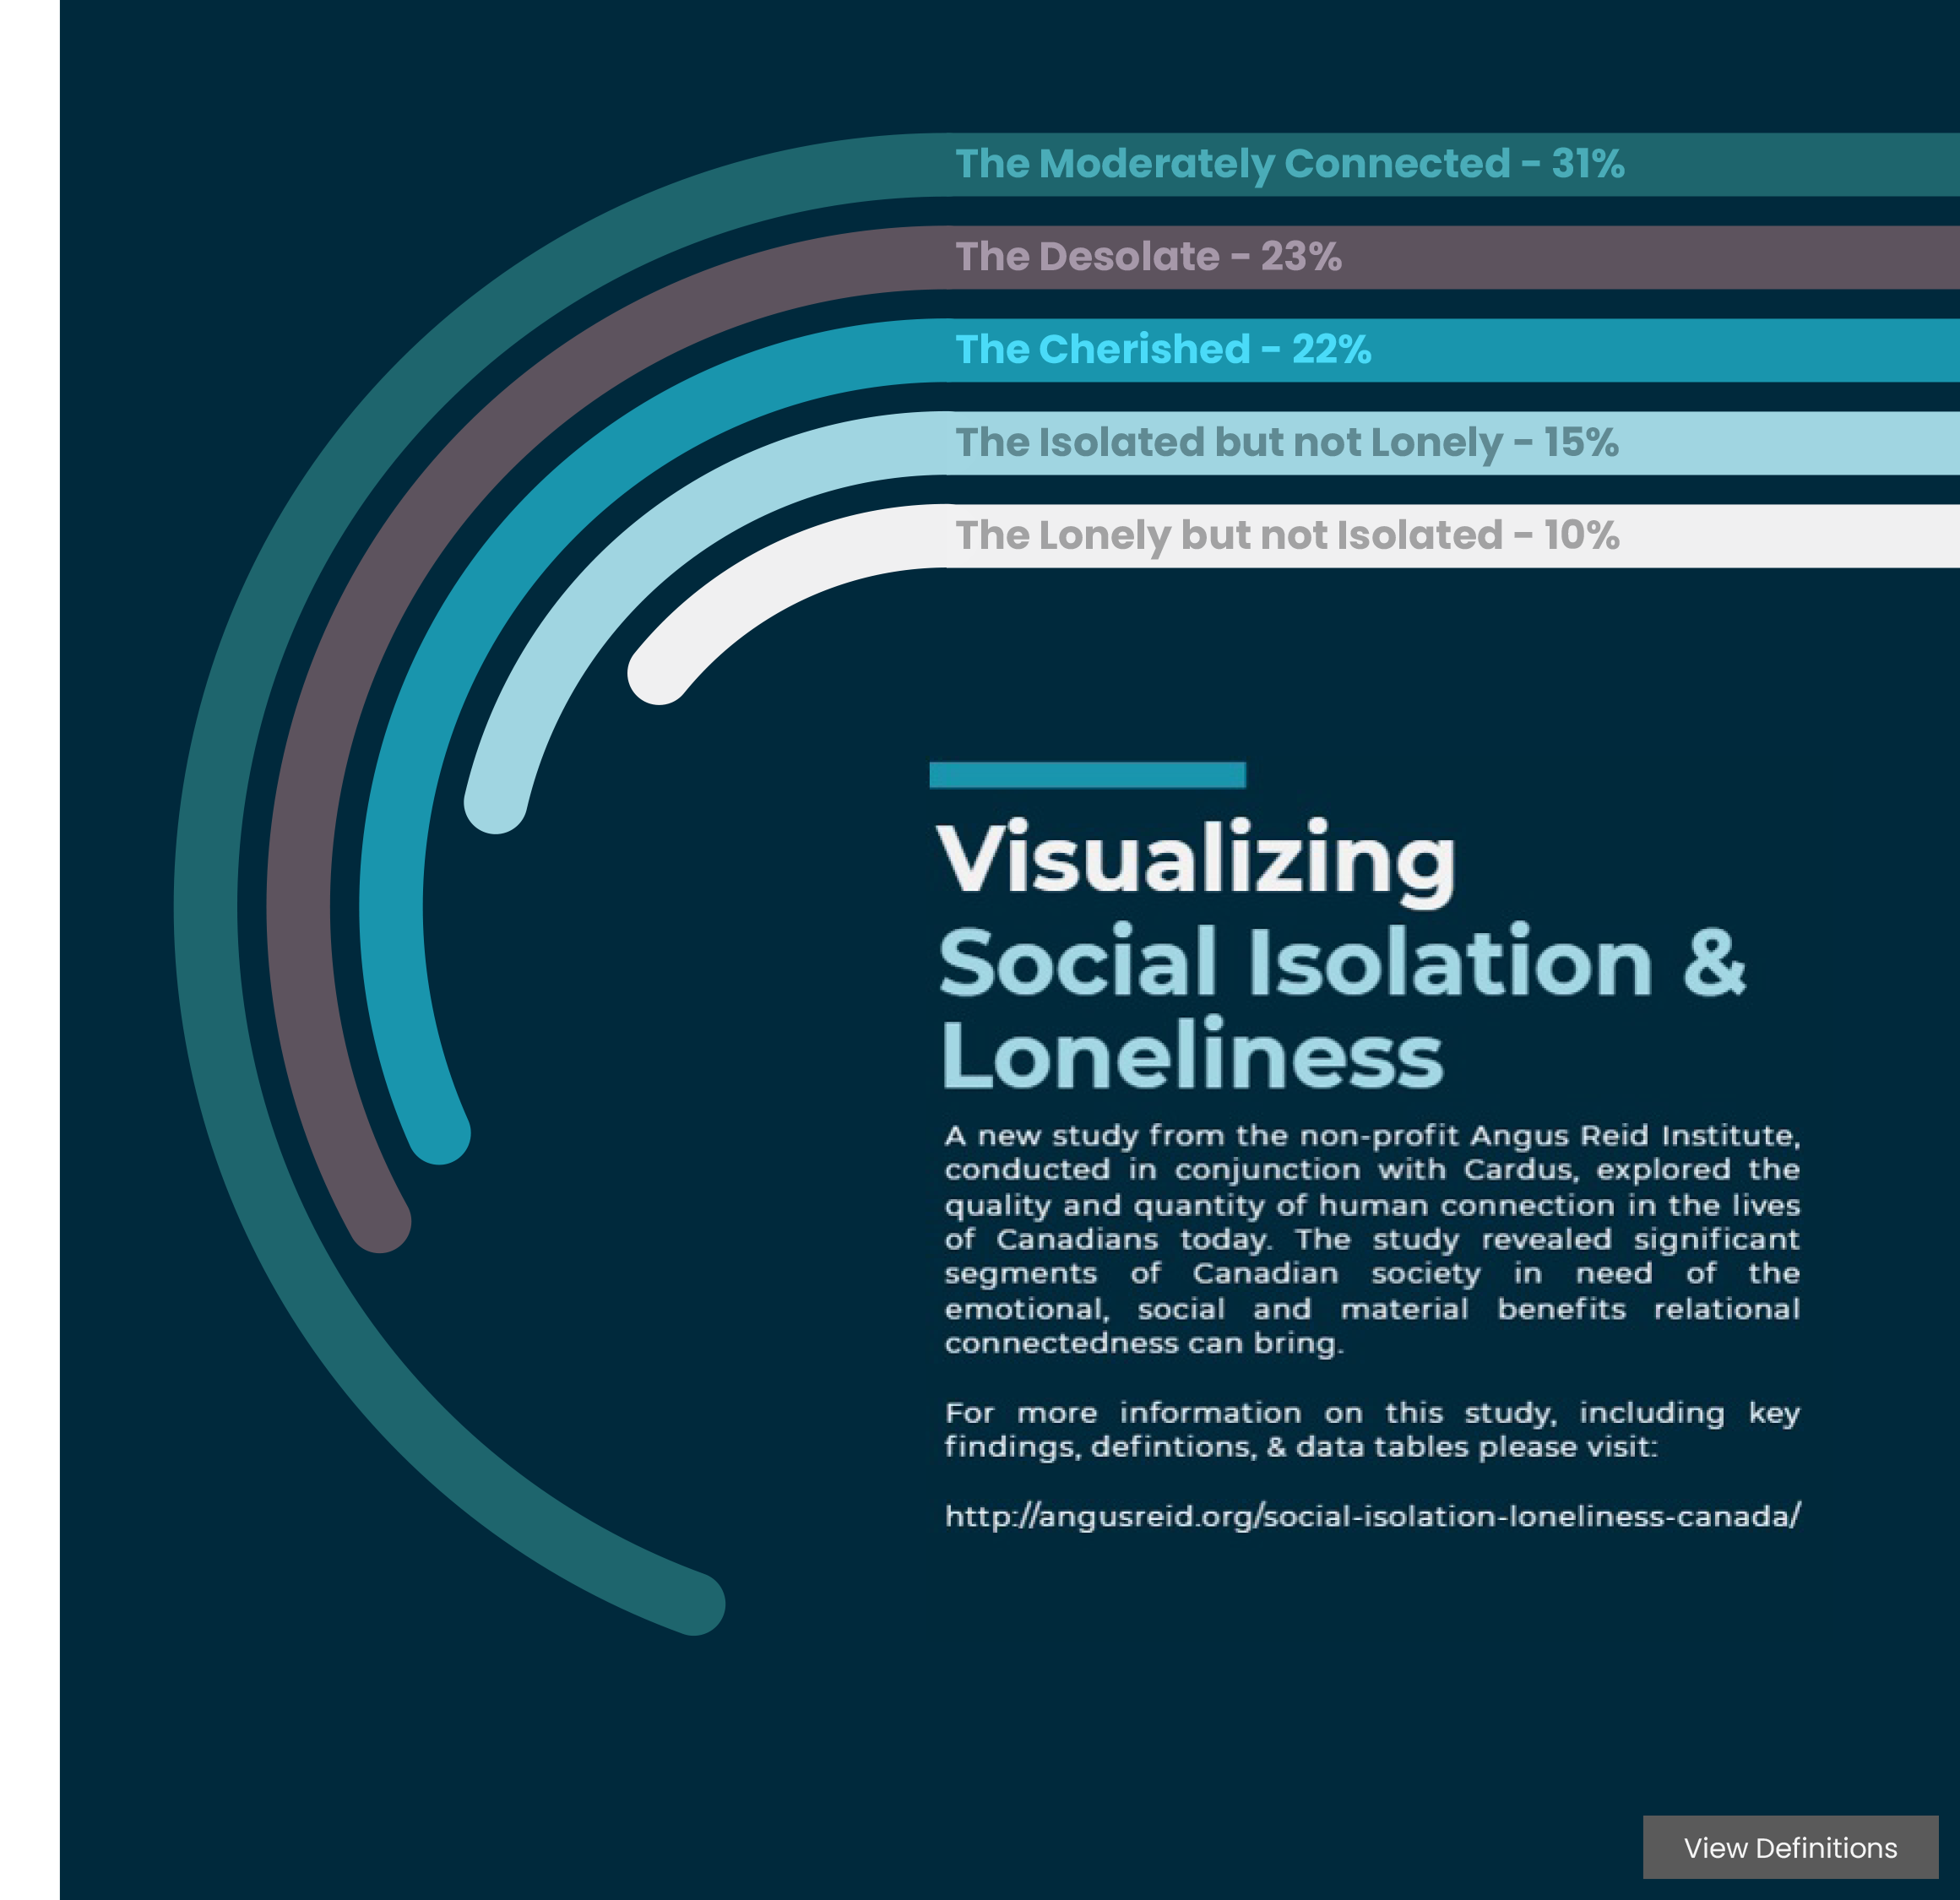
Visualizing Social Isolation and Loneliness
A study from the non-profit Angus Reid Institute, conducted in conjunction with Cardus, explored the quality and quantity of human connection in the lives of Canadians. The study revealed significant segments of Canadian society in need of the emotional, social and material benefits relational connectedness can bring.
Culture Making
Some brief reflections on #data19 and the goodness of gratitude
Syntopical Vizzing
Eighty years ago Mortimer Adler introduced a framework for becoming a more demanding reader. Here are my thoughts on how that framework can be applied to data visualization.
Aristotle and Communicating with Data
What do three modes of persuasion from ancient greek philosophy have to do with data visualization? Here are some thoughts…


